



For the past several years, Pew Research Center surveys have shown stability in U.S. religious life. As a whole, Americans have not clearly grown more or less religious.
Steady national numbers could mean that most people’s religious lives haven’t changed. They could also mean that some Americans are becoming more religious while others are becoming less religious, effectively canceling each other out. Or it could be some of both.
A new Center analysis examines how the same 5,835 U.S. adults changed religiously between 2020 and 2025, using longitudinal data from our American Trends Panel (ATP). Unlike most surveys, which interview a different sample of people each time, this lets us see whether individual Americans are growing more or less religious. It finds that the stability seen in national surveys largely holds at the individual level: Most Americans gave the same answers to our core questions about religion in 2025 that they gave in 2020.
Most U.S. adults did not change much in their religiousness between 2020 and 2025
Among U.S. adults who completed American Trends Panel surveys in both 2020 and 2025, % who __ on each indicator of religiousness
Note: This analysis looks at how the same respondents answered questions about key indicators of religiousness in 2020 and 2025. It focuses on meaningful thresholds: being religiously affiliated vs. not affiliated, attending religious services at least monthly vs. attending less often, praying at least daily vs. praying less often, and viewing religion as very important vs. viewing religion as less important. Those who did not answer are not shown.
Source: American Trends Panel profile surveys conducted Aug. 3-Sept. 20, 2020, and July 8-Aug. 3, 2025.
PEW RESEARCH CENTER
Most U.S. adults did not change much in their religiousness between 2020 and 2025
Among U.S. adults who completed American Trends Panel surveys in both 2020 and 2025, % who __ on each indicator of religiousness
| Did not change | Grew more religious | Grew less religious | |
|---|---|---|---|
| Religious affiliation | 87 | 6 | 6 |
| Religious service attendance | 84 | 6 | 9 |
| Frequency of prayer | 84 | 7 | 8 |
| Religion’s importance in life | 86 | 6 | 8 |
Note: This analysis looks at how the same respondents answered questions about key indicators of religiousness in 2020 and 2025. It focuses on meaningful thresholds: being religiously affiliated vs. not affiliated, attending religious services at least monthly vs. attending less often, praying at least daily vs. praying less often, and viewing religion as very important vs. viewing religion as less important. Those who did not answer are not shown.
Source: American Trends Panel profile surveys conducted Aug. 3-Sept. 20, 2020, and July 8-Aug. 3, 2025.
PEW RESEARCH CENTER
For example, the vast majority of U.S. adults (87%) were either affiliated with a religion in both 2020 and 2025, or were religiously unaffiliated in both years. Far fewer U.S. adults went from having no religious affiliation to identifying with a religion (6%) or dropped their religious affiliation (6%).
Three other key indicators of religiousness – monthly religious service attendance, daily prayer and viewing religion as very important in life – also show stability. Between 84% and 86% of Americans provided the same answers on these measures in 2025 that they did in 2020. Slightly more people indicated that they had become less religious than more religious when it comes to religious service attendance and religion’s importance (3-point and 2-point net declines, respectively). But nothing in the data points to a substantial religious retreat or revival over this period.
Religious change by age group
This general pattern of stability holds across all age groups, from people who were born in the 1990s to people who were born before 1950. In every group, large majorities did not change on any of our four main indicators of religiousness.
Religious change between 2020 and 2025 by age group
Among U.S. adults who completed American Trends Panel surveys in both 2020 and 2025, % who __ on each indicator of religiousness

Note: This analysis looks at how the same respondents answered questions about key indicators of religiousness in 2020 and 2025. It focuses on meaningful thresholds: being religiously affiliated vs. not affiliated, attending religious services at least monthly vs. attending less often, praying at least daily vs. praying less often, and viewing religion as very important vs. viewing religion as less important. Those who did not answer are not shown.
Source: American Trends Panel profile surveys conducted Aug. 3-Sept. 20, 2020, and July 8-Aug. 3, 2025.
PEW RESEARCH CENTER
Religious change between 2020 and 2025 by age group
Among U.S. adults who completed American Trends Panel surveys in both 2020 and 2025, % who __ on each indicator of religiousness
| Did not change | Grew more religious | Grew less religious | Indicator | |
|---|---|---|---|---|
| Born in the 1990s (ages 27-36) | 78 | 11 | 10 | Religious affiliation |
| In the 1980s (37-46) | 86 | 7 | 6 | Religious affiliation |
| In the 1970s (47-56) | 89 | 6 | 5 | Religious affiliation |
| In the 1960s (57-66) | 91 | 5 | 4 | Religious affiliation |
| In the 1950s (67-76) | 90 | 4 | 4 | Religious affiliation |
| Before 1950 (77+) | 95 | 2 | 3 | Religious affiliation |
| Born in the 1990s (ages 27-36) | 84 | 7 | 9 | Religious service attendance |
| In the 1980s (37-46) | 83 | 6 | 10 | Religious service attendance |
| In the 1970s (47-56) | 84 | 7 | 9 | Religious service attendance |
| In the 1960s (57-66) | 83 | 5 | 10 | Religious service attendance |
| In the 1950s (67-76) | 84 | 5 | 10 | Religious service attendance |
| Before 1950 (77+) | 89 | 3 | 8 | Religious service attendance |
| Born in the 1990s (ages 27-36) | 84 | 8 | 8 | Frequency of prayer |
| In the 1980s (37-46) | 83 | 7 | 8 | Frequency of prayer |
| In the 1970s (47-56) | 85 | 7 | 9 | Frequency of prayer |
| In the 1960s (57-66) | 85 | 6 | 7 | Frequency of prayer |
| In the 1950s (67-76) | 86 | 5 | 7 | Frequency of prayer |
| Before 1950 (77+) | 86 | 7 | 6 | Frequency of prayer |
| Born in the 1990s (ages 27-36) | 84 | 6 | 9 | Religion’s importance |
| In the 1980s (37-46) | 85 | 6 | 8 | Religion’s importance |
| In the 1970s (47-56) | 87 | 6 | 7 | Religion’s importance |
| In the 1960s (57-66) | 86 | 7 | 5 | Religion’s importance |
| In the 1950s (67-76) | 87 | 4 | 8 | Religion’s importance |
| Before 1950 (77+) | 86 | 7 | 6 | Religion’s importance |
Note: This analysis looks at how the same respondents answered questions about key indicators of religiousness in 2020 and 2025. It focuses on meaningful thresholds: being religiously affiliated vs. not affiliated, attending religious services at least monthly vs. attending less often, praying at least daily vs. praying less often, and viewing religion as very important vs. viewing religion as less important. Those who did not answer are not shown.
Source: American Trends Panel profile surveys conducted Aug. 3-Sept. 20, 2020, and July 8-Aug. 3, 2025.
PEW RESEARCH CENTER
Younger adults were more likely than older adults to change their affiliation status between 2020 and 2025, either by becoming affiliated with a religion or by leaving one. Among adults born in the 1990s (people who are roughly ages 27 to 36 today), 78% had the same affiliation status in both years. That compares with 95% of adults born before 1950 (who are 77 and older today). But within every age group, roughly equal shares began identifying with a religion and stopped identifying with one during this period.
In most age groups, slightly more adults stopped attending services at least monthly than started. (This net decline in monthly attendance is statistically significant for all age groups except those born in the 1970s and 1990s.) Still, in every group, at least eight-in-ten respondents reported no changes on this measure.
There was also relatively little change in any age group when it comes to daily prayer and the importance of religion in one’s life.
This analysis cannot look at today’s youngest adults (those born in the 2000s) because too few of them were old enough to take our surveys in 2020.
Religious change by gender
There were also no major shifts among men or women between 2020 and 2025. Large majorities of men and women alike did not change on any of the four key indicators of religiousness in this period.
However, both showed a small net decline in monthly religious service attendance. Among men, 9% stopped attending at least monthly, while 5% started doing so. Among women, 10% stopped attending monthly and 6% started.
Religious change between 2020 and 2025 by gender
Among U.S. adults who completed American Trends Panel surveys in both 2020 and 2025, % who __ on each indicator of religiousness
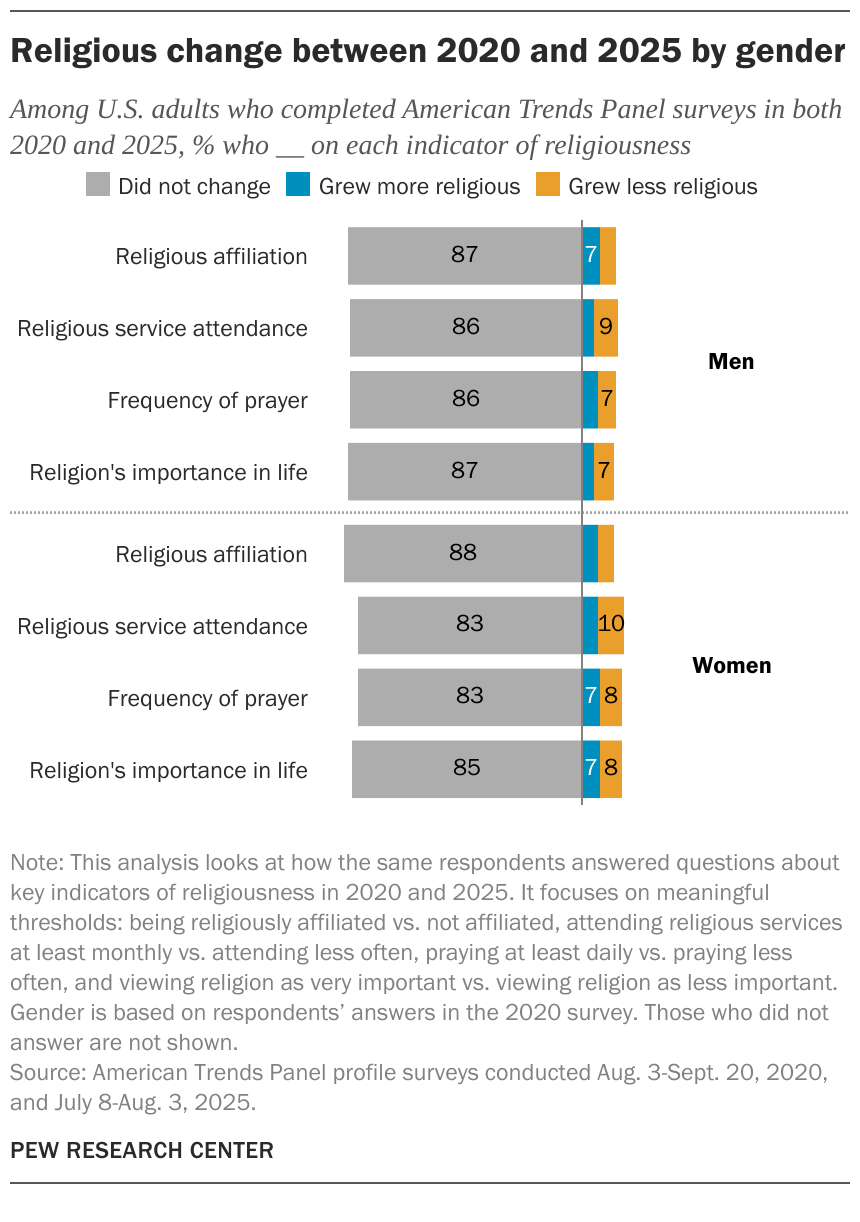
Note: This analysis looks at how the same respondents answered questions about key indicators of religiousness in 2020 and 2025. It focuses on meaningful thresholds: being religiously affiliated vs. not affiliated, attending religious services at least monthly vs. attending less often, praying at least daily vs. praying less often, and viewing religion as very important vs. viewing religion as less important. Gender is based on respondents’ answers in the 2020 survey. Those who did not answer are not shown.
Source: American Trends Panel profile surveys conducted Aug. 3-Sept. 20, 2020, and July 8-Aug. 3, 2025.
PEW RESEARCH CENTER
Religious change between 2020 and 2025 by gender
Among U.S. adults who completed American Trends Panel surveys in both 2020 and 2025, % who __ on each indicator of religiousness
| Did not change | Grew more religious | Grew less religious | Gender | |
|---|---|---|---|---|
| Religious affiliation | 87 | 7 | 6 | Men |
| Religious service attendance | 86 | 5 | 9 | Men |
| Frequency of prayer | 86 | 6 | 7 | Men |
| Religion’s importance in life | 87 | 5 | 7 | Men |
| Religious affiliation | 88 | 6 | 6 | Women |
| Religious service attendance | 83 | 6 | 10 | Women |
| Frequency of prayer | 83 | 7 | 8 | Women |
| Religion’s importance in life | 85 | 7 | 8 | Women |
Note: This analysis looks at how the same respondents answered questions about key indicators of religiousness in 2020 and 2025. It focuses on meaningful thresholds: being religiously affiliated vs. not affiliated, attending religious services at least monthly vs. attending less often, praying at least daily vs. praying less often, and viewing religion as very important vs. viewing religion as less important. Gender is based on respondents’ answers in the 2020 survey. Those who did not answer are not shown.
Source: American Trends Panel profile surveys conducted Aug. 3-Sept. 20, 2020, and July 8-Aug. 3, 2025.
PEW RESEARCH CENTER
Religious change by political party
Among both Republicans and Republican-leaning independents as well as Democrats and Democratic-leaning independents, the shares who said they stopped attending religious services monthly slightly outnumbered the shares who said they started attending at least monthly.
Religious change between 2020 and 2025 by political party
Among U.S. adults who completed American Trends Panel surveys in both 2020 and 2025, % who __ on each indicator of religiousness

Note: This analysis looks at how the same respondents answered questions about key indicators of religiousness in 2020 and 2025. It focuses on meaningful thresholds: being religiously affiliated vs. not affiliated, attending religious services at least monthly vs. attending less often, praying at least daily vs. praying less often, and viewing religion as very important vs. viewing religion as less important. Political party affiliation or lean is based on respondents’ answers in the 2020 survey. Those who did not answer are not shown.
Source: American Trends Panel profile surveys conducted Aug. 3-Sept. 20, 2020, and July 8-Aug. 3, 2025.
PEW RESEARCH CENTER
Religious change between 2020 and 2025 by political party
Among U.S. adults who completed American Trends Panel surveys in both 2020 and 2025, % who __ on each indicator of religiousness
| Did not change | Grew more religious | Grew less religious | Political party | |
|---|---|---|---|---|
| Religious affiliation | 88 | 7 | 5 | Republican/lean Republican |
| Religious service attendance | 84 | 6 | 9 | Republican/lean Republican |
| Frequency of prayer | 83 | 7 | 9 | Republican/lean Republican |
| Religion’s importance in life | 85 | 7 | 7 | Republican/lean Republican |
| Religious affiliation | 86 | 6 | 7 | Democrat/lean Democrat |
| Religious service attendance | 84 | 5 | 10 | Democrat/lean Democrat |
| Frequency of prayer | 86 | 7 | 7 | Democrat/lean Democrat |
| Religion’s importance in life | 87 | 5 | 8 | Democrat/lean Democrat |
Note: This analysis looks at how the same respondents answered questions about key indicators of religiousness in 2020 and 2025. It focuses on meaningful thresholds: being religiously affiliated vs. not affiliated, attending religious services at least monthly vs. attending less often, praying at least daily vs. praying less often, and viewing religion as very important vs. viewing religion as less important. Political party affiliation or lean is based on respondents’ answers in the 2020 survey. Those who did not answer are not shown.
Source: American Trends Panel profile surveys conducted Aug. 3-Sept. 20, 2020, and July 8-Aug. 3, 2025.
PEW RESEARCH CENTER
Overall though, most people in both partisan coalitions did not change on our four key indicators of religiousness between 2020 and 2025.
Note: Here are the questions used from the 2020 survey, along with the methodology. Here are the questions used from the 2025 survey, along with the methodology.
Source: Pew Research Center – www.pewresearch.org